It seems like a long, long time ago when the clarion call for managing the coronavirus pandemic was flattening the curve, but it was only seven months ago. I predicted at the time that the widely communicated and highly effective graphic disseminated by CDC (2020) would become the world’s most famous, influential, and recognizable graphic visualization.
What Blue Marble Evaluation lessons can we extract from the impact of the curve?
- Distinguish delay from prevention. The curve was widely interpreted as a way to prevent the pandemic from spreading, but it was actually aimed at delaying the spread of COVID-19 not ultimately preventing the spread. The delay effort was meant to give the public health system and hospitals time to prepare for the onslaught of expected cases.
- Distinguish data visualization from theory visualization. The flatten the curve graphic is notdataviz. There are no data in the graphic. It’s a depiction of a hypothetical model. The original version appeared in a 2007 report by the Centers for Disease Control and Prevention to justify what were then considered radical recommendations to take in the event of a pandemic: close schools, cancel public gatherings, and “social distancing.”
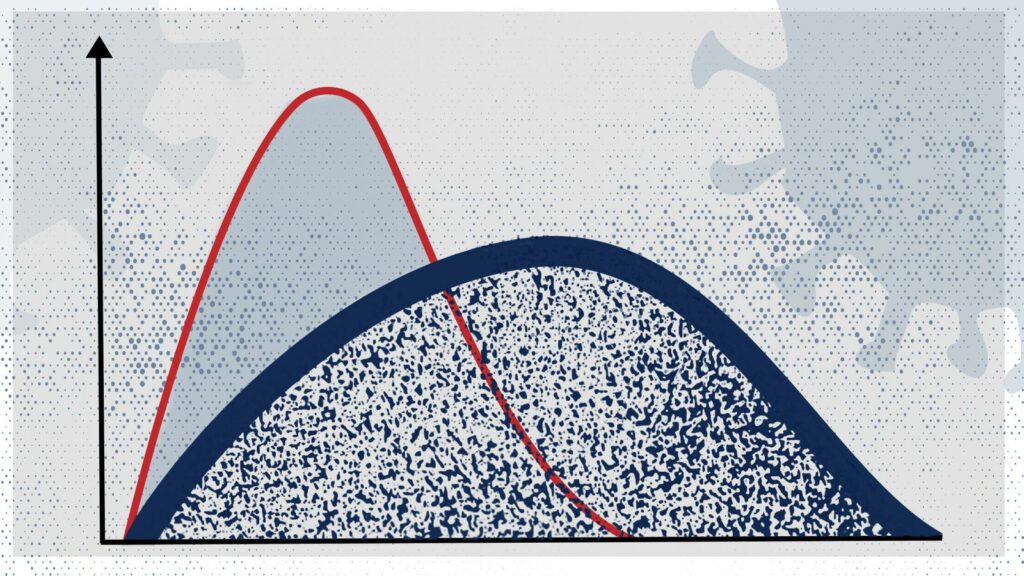
- Effectiveness flowed from creative message simplicity. The curves are theoretical illustrations of a hypothesis comparing hoped-for intervention results versus doing nothing. The visualization shows a mountain (doing nothing) versus a mole hill (timely interventions to flatten the curve). In a thoughtful review of the graphic in Mother Jones Magazine, Abigail Weinberg, a digital media analyst, offered this judgment:
The “Flatten the Curve” chart was ugly and not scientifically rigorous. Why did it work so well?… In truth there was nothing particularly rigorous about the chart. It was a work of the imagination, too artless to be art but lacking the hard empiricism we expect of science. That in-betweenness is what made it so effective.
- Action is possible. Alberto Cairo, an expert in information design and the author of How Charts Lie, says: “Charts are not illustrations. Charts are arguments.” Citing Cairo, Weinberg concludes that “the genius lies in the chart’s implicit promise that our fate is in our own hands.”
- There are multiple curves. “Flattening the curve” referred to the total population. But the population curve consists of the aggregation of many subgroup curves. We now know that significant and enduring disparities show up in COVID-19 infection and death rates, as in other aspects of the US health system, with people experiencing poverty and people of color having as much is two to three times higher infection and death rates than middle-class whites. Worldwide, the poor and displaced are most vulnerable to diseases generally and pandemic viruses in particular. Which curves get priority attention for flattening is a social justice issue. This reflects the Blue Marble Evaluation GLOCAL principle which calls attention to the importance of examining the interconnections between local and specific trends (place and subgroup specific curves) in relation to global curves.
- Time is of the essence. In just a few months, the issue has moved from flattening curve to reducing the size and scope of the second wave. The current infection and death rates are on the rise in certain places and for different populations. The image now is pandemic waves, one after the other, rather than a single curve.
- Generalizing effective images. The pandemic’s flatten the curve graphic has been redrawn to communicate the urgent need to flatten the curve of global warming.
The climate change graphic isn’t accurate either theoretically or empirically. The pandemic curve assumes that the pandemic ends at some point with or without intervention, so both curves (with and without intervention) go up and then come down. But the climate change curve doesn’t come down without intervention. It keeps going up, a hockey stick image, not a mountain with an upside and a downside. The climate emergency curves depicting the Great Acceleration are true dataviz charts, not theoretical but empirical.
- Climate emergency disparities are huge and growing. Just as the Coronavirus has highlighted huge health disparities, social justice disparities are manifest in the climate arena globally as well as within countries. The countries that participate in OECD are wealthier and use substantially more primary energy per capita, as can be seen in this graph. Only 1/6th of the world’s population lives in the OECD countries though they have most of the wealth and energy use.
Being World Savvy
Blue Marble Evaluators must be historians (what’s happened in the past), futurists (what do trends portend) and cross-silos analysts — capable of comparing across sectors, geographies, and issues, like the pandemic, climate change, and social justice to see systems interrelationships. To do so means fighting an uphill battle (never-ending upward curve) against the human tendency to ignore history’s lessons.
This year is the 250th anniversary of the birth of the great German philosopher Georg Wilhelm Friedrich Hegel (born 1770). Hegelian logic has implications for evaluative thinking and the Blue Marble Evaluation yin-yang principle which was the focus of the August Blue Marble Evaluation book club. You can listen to the tape of that session here. But, to conclude this blog post, I quote Hegel’s perspective on humanity’s historical learning curve:
The future of humanity on Earth may well depend on changing our historical learning curve. That is a Blue Marble Evaluation challenge.
Principle 2: Anthropocene as Context, Principle 6: GLOCAL, Principle 8: Time being of the essence, Principle 9. Yin-Yang